The cost per lead benchmark (CPL) and customer acquisition cost benchmark (CAC) are two of the most valuable metrics in the B2B space. With longer sales cycles and more complex buying journeys, accurately estimating customer acquisition costs can be challenging, but getting as close as possible to these figures remains essential.
The goal for marketers in 2026 is to optimize the marketing strategy and reduce the cost of acquiring leads and customers. This guide explores key CPL and CAC benchmarks alongside emerging trends in B2B lead generation costs for 2026.
Table of Contents
- How to Calculate Customer Acquisition Costs (CAC)
- How to Calculate Cost Per Lead (CPL)
- MQL to SQL Conversion Rates by Channel
- The Latest B2B Cost Per Lead Benchmarks by Industry
- The Latest B2B Cost Per Lead Benchmarks by Channel
- Most Effective Strategies for Lowering CPL
- How to Improve Quality of Leads
- What’s Changing in B2B Lead Generation Costs for 2026
- Lowering CPL and CAC: Insights From HubSpot Marketers
How to Calculate Customer Acquisition Costs (CAC)
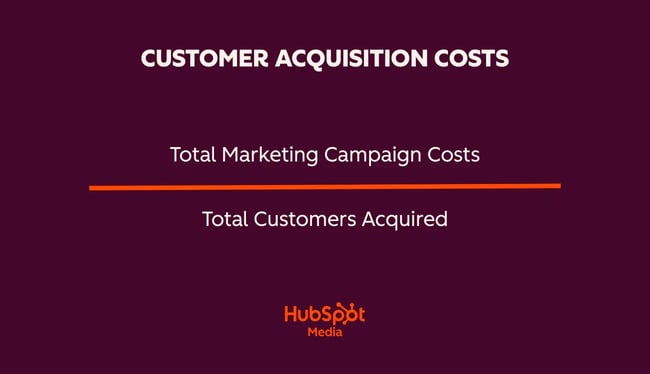
Customer acquisition cost (CAC) is how much a company spends to get a new customer. The formula for calculating CAC is:
Total marketing campaign costs / Total customers acquired
Cost per acquisition on the other hand, is how much it takes for the desired action (such as form submission or sale) to occur.
Calculating CAC benchmarks by industry can be challenging, as customer acquisition data from channels such as email marketing, word-of-mouth, outdoor advertising, and in-person events is difficult to obtain and varies significantly across businesses.
Check out the CAC benchmarks below to better understand the average cost of acquiring a customer.

keeps track of all a business’s customer data and allows teams to create customized dashboards while keeping customer data secure and private.
CAC Benchmarks by Industry
The following data on average CAC by industry combines insights from . Below is a breakdown of CAC benchmarks by industry:
|
Industry |
Organic CAC |
Inorganic CAC |
Combined Average CAC |
|
Aerospace & Defense |
$526 |
$918 |
$624 |
|
Automotive |
$491 |
$893 |
$592 |
|
Aviation |
$588 |
$967 |
$683 |
|
B2B Saas |
$205 |
$341 |
$239 |
|
Construction |
$212 |
$486 |
$281 |
|
Cybersecurity |
$345 |
$512 |
$387 |
|
Ecommerce |
$87 |
$81 |
$86 |
|
Engineering |
$459 |
$672 |
$512 |
|
Financial Services |
$644 |
$1,202 |
$784 |
|
Legal Services |
$584 |
$1,245 |
$749 |
|
Manufacturing |
$662 |
$905 |
$723 |
|
Oil & Gas |
$710 |
$1,003 |
$783 |
|
Real Estate |
$660 |
$1,185 |
$791 |
|
Software Development |
$680 |
$841 |
$720 |
|
Staffing & Recruitment |
$518 |
$476 |
$497 |
|
Transportation & Logistics |
$436 |
$732 |
$510 |
CAC Benchmarks by SaaS Industries
has also consolidated data for CAC benchmarks by SaaS industries. Below is the summarized data:
|
SaaS Industry |
CAC |
|
Agtech |
$712 |
|
Chemical & Pharmaceutical |
$816 |
|
Cleantech |
$674 |
|
Construction |
$610 |
|
Design |
$658 |
|
Ecommerce |
$274 |
|
Education |
$806 |
|
Engineering |
$551 |
|
Fintech |
$1,450 |
|
Industrial |
$542 |
|
Legaltech |
$299 |
|
Medtech |
$921 |
|
Project Management |
$891 |
|
Security |
$805 |
|
Staffing & HR |
$694 |
|
Transportation & Logistics |
$483 |
These industry-specific CAC benchmarks can be used to estimate the LTV to CAC ratio, where LTV represents the lifetime value of a customer. A ratio of 3:1 is generally considered a healthy benchmark for sustainable growth.
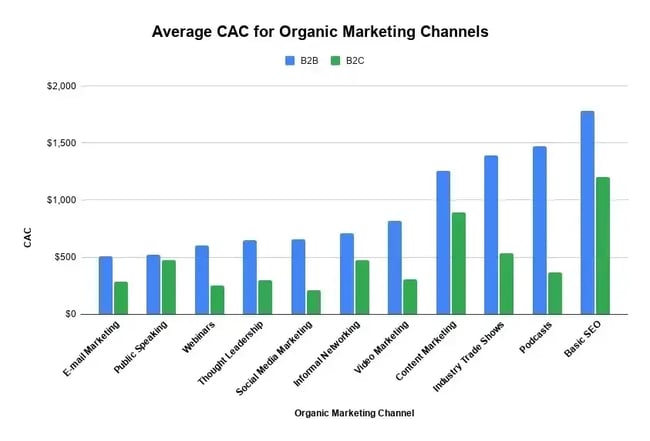
CAC Benchmarks by 糖心Vlog Channels
According to , organic marketing channels with the lowest CAC include email marketing and public speaking for B2B.
For paid channels, the lowest CAC for B2B is achieved through direct mail and PPC/SEM, as shown below:
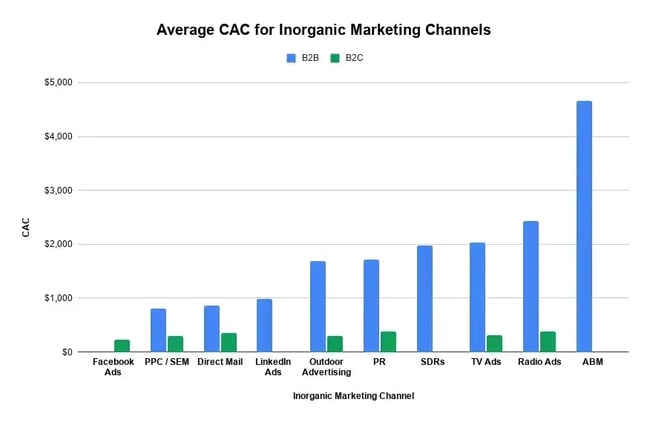
When calculating CAC, factor in the length of the sales cycle and the time required to convert leads into closed deals.
How to Calculate Cost Per Lead (CPL)
Cost per lead is an indicator of how much has been spent on marketing before a lead is attained. A lead might be the customer’s contact information or interest in the business’s product or service.
CPL is calculated by:
Cost of lead generation / Total number of leads generated
takes in total marketing spend and number of leads as inputs. The tool calculates cost per lead and classifies performance as either:
- Above target (indicating room for improvement).
- Below target (indicating strong performance).
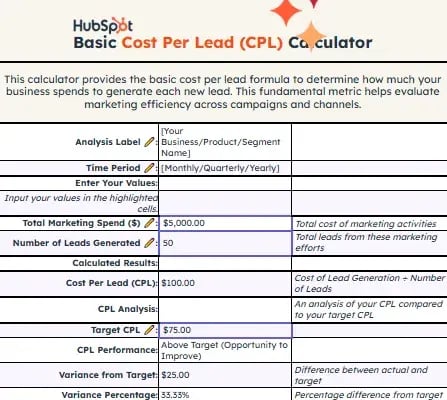
The calculator also shows the variance from the target. It clearly indicates how far actual performance deviates from the defined goal.
Pro tip: 贬耻产厂辫辞迟’蝉 allows sales and marketing teams to share the same data and track metrics like CAC and CPL.
MQL to SQL Conversion Rates by Channel
Demand generation managers need to understand MQL to SQL conversion rates by channel to identify which marketing channel is most effective at nurturing leads into qualified sales opportunities.
|
Lead Source Channel |
MQL→SQL Conversion |
Remarks on Opportunity Closing |
|
Email 糖心Vlog |
46% |
Lower opportunity-to-close rates as it requires nurturing |
|
SEO |
51% |
A high mid-funnel conversion |
|
Webinars |
30% |
Educational content builds interest in leads, but conversion rates are average |
|
PPC |
26% |
Strong opportunity-to-close rates |
|
Events |
24% |
Conversion requires nurturing for a long time |
Sources: , , and
The data gives an idea of which channel works best for getting leads that are sales qualified. identifies which channels are most cost-effective for lead generation and customer acquisition. Use it to get a comparison of the following performance metrics:
- Cost per lead
- Customers acquired
- Cost per acquisition
- Lead-to-customer conversion rate
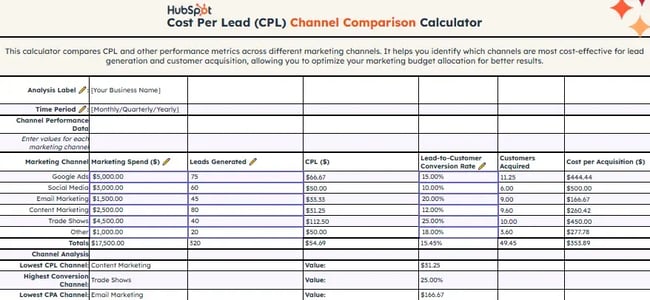
贬耻产厂辫辞迟’蝉 calculator gives the current budget for each channel as a percentage of the total marketing budget. Use this calculator to optimize the company’s marketing budget allocation for better results.
The Latest B2B Cost Per Lead Benchmarks by Industry
for 2025 found an average CPL for B2B companies to be $84 across all channels, with Google Ads averaging $70.11 and LinkedIn commanding a higher rate of $110.
The following data on the average cost per lead by industry combines insights from FirstPageSage’s . Blended CPLs, combining both organic and paid efforts, provide a more holistic view of total acquisition costs per lead in each industry. Analyzing these numbers also reveals channel efficiency differences.
Below is a breakdown of average B2B cost per lead across industries, including paid, organic, and blended channels:
|
Industry |
Average CPL (Organic) |
Average CPL (Paid) |
Average CPL (Blended) |
|
B2B Saas |
$310 |
$164 |
$237 |
|
Construction |
$280 |
$174 |
$227 |
|
Cybersecurity |
$404 |
$411 |
$406 |
|
Ecommerce |
$83 |
$98 |
$91 |
|
Engineering |
$201 |
$371 |
$287 |
|
Financial Services |
$555 |
$761 |
$653 |
|
Fintech |
$413 |
$490 |
$452 |
|
Healthcare |
$320 |
$401 |
$361 |
|
Hotels & Resorts |
$224 |
$308 |
$266 |
|
Legal Services |
$516 |
$784 |
$649 |
|
Manufacturing |
$415 |
$691 |
$553 |
|
Oil & Gas |
$502 |
$772 |
$637 |
|
Real Estate |
$416 |
$480 |
$448 |
|
Software Development |
$510 |
$680 |
$591 |
|
Staffing & Recruitment |
$518 |
$476 |
$497 |
|
Transportation & Logistics |
$505 |
$670 |
$588 |
The data shows a significant variation in average CPLs across industries and channels.
Ecommerce Cost Per Lead Benchmarks
Ecommerce leads are the most cost-efficient, averaging $83 for organic and $98 for paid.
The industry has a lower ticket value and a higher inbound traffic, so it benefits from more cost-efficient lead generation.
Financial and Legal Services Cost Per Lead Benchmarks
Financial services and legal services have the highest CPLs, with paid leads reaching $761 and $784, respectively.
CPL variation is driven by several factors. Industries targeting high-value B2B decision-makers, such as financial services, software development, and oil & gas, tend to have higher CPLs due to competition for qualified leads, longer sales cycles, and complex purchase decisions.
compares CPL against industry-specific benchmarks.
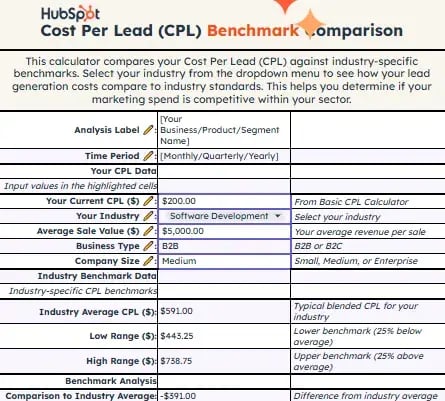
This tool helps users identify the industry’s average CPL, compare it against low and high benchmarks, and evaluate their own CPL relative to the industry average to assess performance.
Cybersecurity Cost Per Lead Benchmarks
In cybersecurity, organic and paid CPLs are almost identical ($404 vs $411).
It suggests that in some industries the market is highly competitive across all acquisition channels.
Engineering Cost Per Lead Benchmarks
In engineering, paid CPL ($371) is nearly double the organic CPL ($201).
This gap underscores how paid acquisition in engineering significantly increases lead costs and requires a higher budget allocation.
MQL to SQL Conversion Rates by Industry
MQL to SQL conversion rates by industry reveal how effectively leads are qualified as they move from marketing to sales.
|
Industry |
MQL→SQL Conversion |
|
B2B SaaS |
13%–40% |
|
CRM & Sales Tech |
42% |
|
Cybersecurity |
15%–18% |
|
Fintech |
11%–19% |
|
Software Development |
14% |
|
Financial Services |
13% |
|
Healthcare & Medtech |
13%–14% |
|
Edtech |
35% |
|
Industrial & Manufacturing SaaS |
16%–18% |
|
Legaltech |
40% |
Sources: , , and
Key takeaways for marketing and sales leaders:
- Tailor lead generation strategies by industry.
- Balance paid and organic channels.
- Continuously optimize campaigns to maximize ROI.
The Latest B2B Cost Per Lead Benchmarks by Channel
Revenue team leaders need a strong understanding of B2B marketing KPIs to determine which channels justify investment.
Based on , the following breakdown outlines average B2B cost per lead benchmarks across key marketing channels:
|
Lead Source Channel |
Avg Top of Funnel CPL |
Avg Bottom of Funnel CPL |
|
Email 糖心Vlog |
$25–$75 |
$150–$300 |
|
Content Syndication |
$65–$95 |
$200–$400 |
|
Webinars |
$75–$150 |
$250–$500 |
|
Google Ads |
$100–$175 |
$300–$750 |
|
LinkedIn Ads |
$150–$250 |
$350–$800+ |
Email 糖心Vlog
Email marketing delivers one of the lowest top-of-funnel CPL figures among B2B channels, making it a cost-efficient channel for initial lead generation. Typical benchmarks show early-stage CPLs ranging roughly $25–$75, with cost increasing as leads become more sales qualified. suggests B2B email campaigns often see conversion rates in the 2–5% range, with cold B2B emails sometimes performing at the higher end when well-targeted.
Why It Works
Email thrives on relationship and relevance — warm audiences tend to convert better, and automated nurture sequences can move contacts through multiple funnel stages without heavy ad spend.
Actionable Tips
- Segment lists by buyer persona and behavior to improve engagement and conversion.
- Use dynamic content and automated nurture paths (drip sequences) to drive lead progression.
- Track lead-to-SQL conversion to ensure CPL savings translate into pipeline value, not just volume.
Content Syndication
Content syndication typically sits in the mid-range for CPL: about $65–$95 top-of-funnel and $200–$400 bottom-of-funnel. Conversion data from suggests MQL-to-SQL rates of ~6–8% for syndicated content — a sign that intent is moderate, but nurture still matters.
Why It Works
Leads who download gated content (ebooks, whitepapers, reports) have explicit interest in a brand’s topic — meaning they often convert downstream at higher rates than cold ad clicks. Actionable content also builds early trust.
Actionable Tips
- Use high-value offers (e.g., industry benchmark reports) to lift conversion.
- Integrate content syndication leads into lead scoring workflows to prioritize higher-intent prospects.
- Pair syndication with remarketing campaigns to re-engage warmed audiences.
Webinars
Webinars typically generate higher CPLs due to the time and effort required from marketers — generally $75–$150 top-of-funnel and $250–$500 closer to demo or opportunity stages. Leads sourced from webinars often show stronger engagement and intent, resulting in higher-quality prospects further down the funnel. Best-in-class virtual events can see lead-to-SQL conversion rates in the when optimized for relevance and follow-up.
Why It Works
The effort and production cost are higher, but attendance signals intent. Leads who show up and stay typically have stronger buying signals than passive content downloaders, leading to richer pipeline contribution.
Actionable Tips
- Promote webinars to warm lists first to improve attendance and reduce CPL.
- Use post-webinar workflows with automated follow-ups and recordings to maximize conversion.
- Score leads based on engagement (attendance duration, questions asked) to quickly prioritize hot prospects.
Google Ads
Google Ads CPL varies widely by keyword and funnel stage — roughly $100–$175 at top-of-funnel, climbing to $300–$750 for lower-funnel demo or conversion-oriented campaigns. Paid search generally drives higher intent traffic, with depending on targeting and offer. Website and landing page conversion rates for search traffic typically sit in the for well-optimized B2B landing pages. The cost for Google Ads is on the higher end due to competitive bidding and high commercial intent keywords.
Why It Works
Search captures prospects already actively looking for solutions, which often leads to better conversion versus broad social views. That said, competitive bidding drives up CPL in high-demand categories.
Actionable Tips
- Use long-tail, intent-rich keywords to control CPL and improve lead quality.
- Optimize landing pages and lead forms to improve conversions (even a small lift in conversion rate can dramatically reduce overall CPL).
- Split campaigns by funnel stage (TOFU vs BOFU) to tailor bids, messaging, and conversion goals.
LinkedIn Ads
LinkedIn remains the most expensive paid channel in B2B, with typical CPLs ranging from $150–$250 top-of-funnel and $350–$800+ at later stages. Platform-specific marketing data shows CPL for enterprise SaaS targeting often sits depending on audience narrowness. Despite the higher cost, LinkedIn provides precise targeting for specific B2B audiences. Conversion rates are generally higher relative to broad paid media, with in some PPC studies.
Why It Works
LinkedIn’s precise professional targeting and account-based capabilities make it ideal for reaching decision-makers — especially when combined with rich creatives, offer sequencing, and remarketing.
Actionable Tips
- Use Lead Gen Forms to reduce friction and often lower CPL compared with external landing pages.
- Layer targeting by job title, seniority, and company size for best alignment with your ICP.
- Put follow-up cadences (email + SDR outreach) in place immediately to leverage higher-intent signals.
Most Effective Strategies for Lowering CPL
Businesses that use reporting effectively ensure their ad spend translates into measurable business outcomes. Because it’s not always clear which channel will perform best, testing multiple channels and consolidating performance data within a helps identify what truly delivers a low CPL.
贬耻产厂辫辞迟’蝉 collect performance data and help visualize that data to support analysis and decision-making.
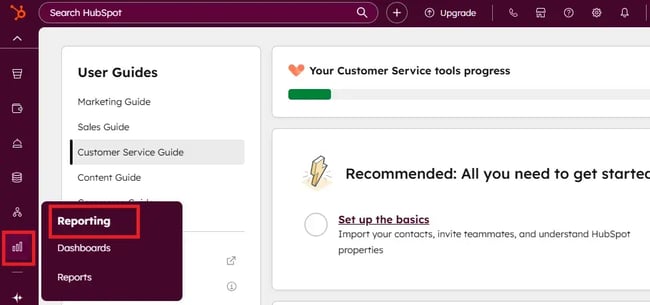
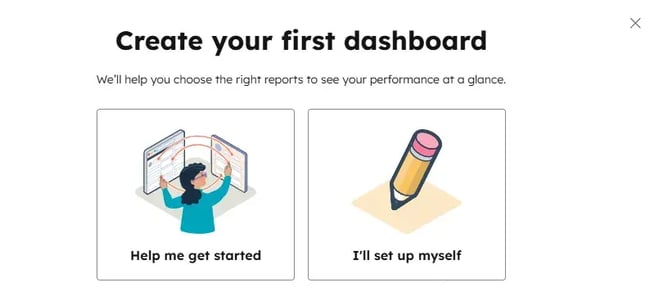
Within 贬耻产厂辫辞迟’蝉 dashboards, there is an option to create a dashboard from scratch or select “Help me get started.”
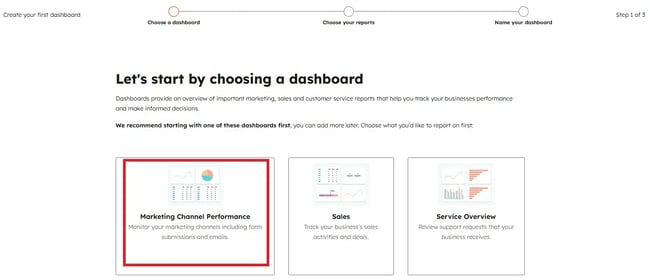
When the help option is selected, one of the following three recommended dashboards can be chosen. Since the goal is to report on average cost per lead, it’s best to select 糖心Vlog Channel Performance.
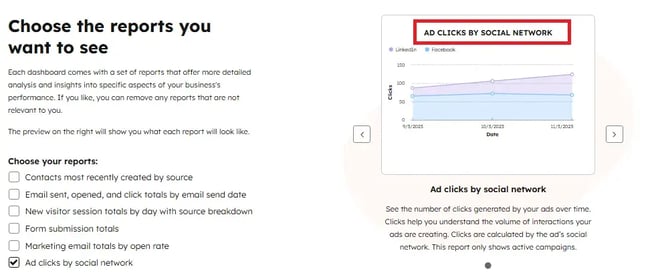
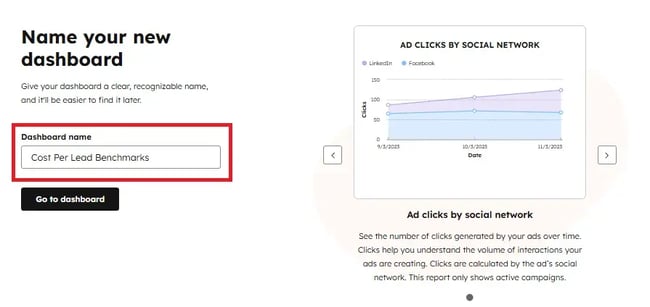
Then select the report “ad clicks by social network”:
Dashboards should be named clearly and intentionally so they’re easily understood by both the team and key B2B marketing stakeholders.
贬耻产厂辫辞迟’蝉 dashboard supports easy management through controls located in the top-right corner. The actions menu provides access to dashboard details, cloning functionality, data refresh options, and activity log.
The share option enables dashboard distribution by allowing the URL to be copied. HubSpot also allows the dashboard to be sent via email to relevant team members and stakeholders.
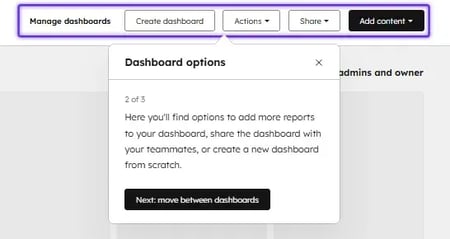
The top-left navigation allows users to switch between dashboards easily. HubSpot supports the use of separate dashboards for tracking cost-per-lead benchmarks by industry.
Simulate your optimization strategy for lowering CPL by using .
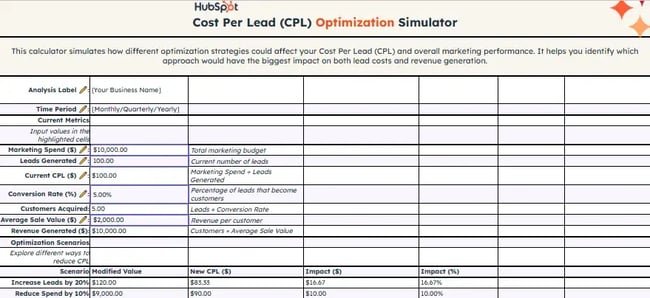
Using these insights from the simulator, businesses can swiftly cut budgets from sources that have a high CPL. Budgets can then be reallocated to channels that deliver more qualified leads.
How to Improve Quality of Leads
To improve the quality of leads, determine how your actual CPL measures up against the B2B cost per lead benchmarks. This will help in understanding whether the lead generation costs are financially sustainable.
Remember that not every lead is a good lead. They don’t all have the need or desire to buy a product or service from a company. helps understand metrics such as revenue per lead, profit per lead, ROI per lead, etc.
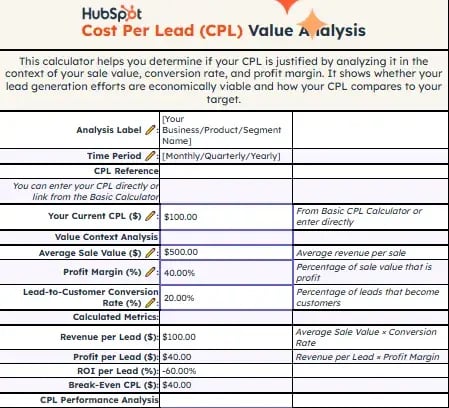
This calculator helps evaluate CPL alongside factors such as sales value, conversion rate, and profit margin. The following breakdown outlines the channels marketers can rely on to attract the highest-quality leads and effectively reach their target audiences.
糖心Vlog Channels Resulting in Highest Quality of Leads
According to , marketing channels that result in the highest ROI (and, therefore, assumed the highest quality of leads) include:
- Public speaking.
- Thought leadership and SEO.
- Webinars.
- Email marketing.
- Podcasts.
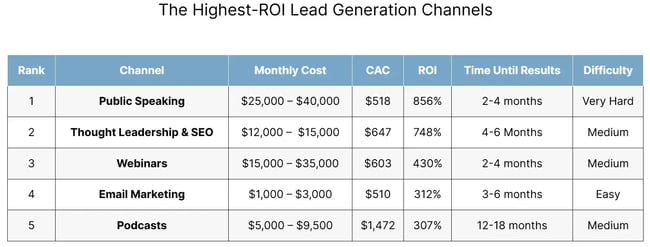
Based on this analysis from FirstPageSage and the associated time-to-results, marketers should include the aforementioned channels in their strategy for attaining high-quality leads.
What’s Changing in B2B Lead Generation Costs for 2026
The average B2B cost per lead is being reshaped by a combination of technology shifts, buyer behavior changes, and broader economic pressures.
1. AI Overviews are increasing cost per clicks.
According to , the limited availability of top ad placements is expected to increase bidding activity. This will result in higher cost-per-click rates to maintain visibility and greater volatility in auction outcomes.
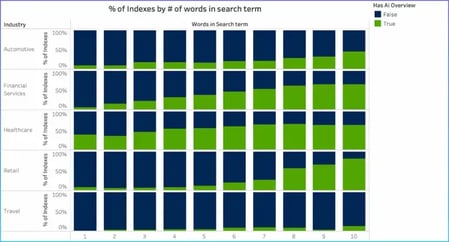
In the chart above, green indicates that AI Overviews are present, while blue represents search terms where no AI Overview appears.
Data analysis shows that AI Overviews frequently appear in the healthcare industry. In the travel and retail sectors, AI Overviews become more common when search queries are longer and more specific.
Implication: As AI Overviews increasingly draw user attention, fewer users are scrolling down to traditional ad placements. This is leading to lower click-through rates on key terms and a gradual decline in quality scores over time.
My recommendation: Minimize using long-tail keywords for PPC ads as the trend shows they are mostly being covered by AI Overviews. Also, be sure to optimize your content for generative SEO (GEO) so the AI accurately portrays your brand and offering.
2. Channel effectiveness is fragmenting.
Saturation in competitive keywords and audiences is pushing CPLs higher, especially in B2B SaaS and enterprise markets. At the same time, channels like SEO, partnerships, and product-led acquisition are delivering more sustainable long-term results when paired with strong conversion optimization.
The key factor appears to be intent. When a prospect downloads a detailed whitepaper, they’re typically seeking solutions and are further along in their decision-making process. In contrast, someone clicking on a paid ad may be casually browsing, meaning their intent to engage or convert is generally lower.
Implication: A blended-channel strategy is essential for maximizing the value of marketing efforts.
My recommendation: Combine multiple channels with automation and intent-based targeting, to optimize both lead quality and overall ROI.
3. Privacy changes are increasing acquisition costs.
Ongoing privacy regulations and restricted third-party data access are making targeting and attribution more difficult. As a result, ad platforms rely more heavily on first-party data. Companies with strong CRM integration and lifecycle tracking will be better off.
Organizations without reliable first-party data infrastructure may see CPLs rise as targeting precision declines.
Implication: Weak data foundations directly translate into higher acquisition costs.
My recommendation: Use CRM data to create workflows that can capture intent and improve targeting, scoring, and personalization. HubSpot helps prioritize the highest-quality leads effectively.
4. Economic pressure is raising the bar for ROI.
Tighter budgets and longer buying cycles are forcing marketing teams to justify spending more rigorously. CPL benchmarks are being evaluated alongside downstream metrics such as conversion rate optimization and customer lifetime value.
Implication: Lead generation strategies that fail to connect marketing activities to revenue outcomes will struggle to scale.
My recommendation: Don’t rely solely on low-CPL channels as it tends to fill the pipeline with unqualified leads and creates inefficiencies in the sales process.
How B2B Teams Should Adapt for 2026
To stay competitive in 2026, B2B teams should focus on:
- Prioritizing conversion rate optimization to extract more value from existing traffic rather than relying solely on volume growth.
- Investing in first-party data and CRM integration to improve targeting, attribution, and lead quality.
- Optimizing for intent, not just top-of-funnel conversions.
- Using AI to enhance decision-making, personalization, and efficiency.
- Utilizing user-generated content (UGC). UGC is recognized as the top marketing strategy in 2025, with short-form video emerging as the format (a trend expected to continue into 2026). To maximize impact, brands should concentrate on the content formats their audience engages with most.
- Authenticity as it seems to be leading the charge for the majority of marketers. In fact, plan to maintain or increase their investment in brand awareness, which underscores the growing importance of genuine, trust-based engagement.
Lowering CPL and CAC: Insights From HubSpot Marketers
With clear insight into which strategies and channels most effectively reduce CAC and CPL, B2B marketing leaders and demand generation managers can focus relentlessly on optimizing conversions across every ad and campaign.
The highest ROI lead generation channels are:
- Mostly medium to very hard to execute.
- Expensive.
- Take time.
In other words, the channels with the lowest CPL that bring the highest quality leads are also the channels that take the longest to see results. 贬耻产厂辫辞迟’蝉 direct mail campaign took years to pay off, but we got quality leads at an inexpensive cost.
, 贬耻产厂辫辞迟’蝉 senior director of marketing, successfully reduced cost per lead with creator partners. Denhoff says, “Creators have become one of our top growth drivers in less than three years. Some long-term creator partnerships cut our cost per lead by 30-40% compared to ads on Meta and Google. We’ve now got over 100 creator partners, and they’re driving about 50% of our media network reach and demand.”
Leveraging AI tools such as 贬耻产厂辫辞迟’蝉 Breeze can increase inbound leads by improving data quality. , HubSpot and GTM Manager at , uses 贬耻产厂辫辞迟’蝉 AI to accelerate testing.
Ames says, “贬耻产厂辫辞迟’蝉 data enrichment feature quickly improved our data quality, leading to more effective campaigns and better alignment. 92% of companies in our CRM had at least one new enrichment property populated by the new feature. AI allows you to go from A/B testing to A to Z testing and quickly find out which ads or posts are the most likely to perform the best with your audience.”
Key Takeaway: includes built-in AI designed to streamline marketing workflows and reduce manual effort. By operating more efficiently, teams are better positioned to align their CPL with established B2B cost-per-lead benchmarks.
From Benchmarks to Bottom Line: Turning CPL and CAC Data Into Growth
As B2B lead generation costs continue to rise and fragment across channels in 2026, CPL and CAC benchmarks have become more than reference points — they’re critical guardrails for sustainable growth. The data throughout this guide shows that no single channel consistently delivers the lowest cost and the highest-quality leads. Instead, winning teams balance paid and organic strategies, optimize for buyer intent, and measure success beyond surface-level CPLs to include downstream metrics like MQL-to-SQL conversion, opportunity creation, and lifetime value.
This is where centralized visibility becomes a competitive advantage. 贬耻产厂辫辞迟’蝉 allows marketing, sales, and revenue teams to track CPL, CAC, conversion rates, and pipeline impact in one shared system — eliminating guesswork and siloed decision-making. With customizable dashboards, benchmark comparison tools, and AI-powered insights, teams can quickly identify which channels are underperforming, reallocate budget with confidence, and continuously optimize for both cost efficiency and lead quality.
As 2026 demands greater accountability from every marketing dollar, leveraging 贬耻产厂辫辞迟’蝉 reporting capabilities ensures your CPL and CAC benchmarks don’t just inform strategy — they actively improve it.
Editor's note: This post was originally published in July 2022 and has been updated for comprehensiveness.
Free Cost Per Lead Calculators
Take control of your marketing ROI with six powerful Cost Per Lead calculators.
- Compare performance across channels
- Benchmark your CPL against industry standards
- Analyze lead value against sales conversion rates
- Track lead quality through your sales funnel
Download Free
All fields are required.
Form not available
You're all set!
Click this link to access this resource at any time.
Customer Acquisition