
Calculating your total addressable market (TAM), serviceable addressable market (SAM), and serviceable obtainable market (SOM) can be helpful beyond the realm of just marketing.
Business owners can use these calculations to determine the viability of a business. Product teams can validate new product offerings. And that’s just the tip of the iceberg when it comes to the potential of the TAM, SAM, and SOM trio.
Ignoring these numbers can be detrimental. You could enter a market that isn’t large enough to convince investors to back you, or you could set an unrealistic revenue goal for your business and burn out your employees.
To help you avoid these issues, I’ve put together a guide that’ll teach you exactly how to calculate your industry’s total addressable market, serviceable addressable market, and share of market.
Numbers not your strong suit?
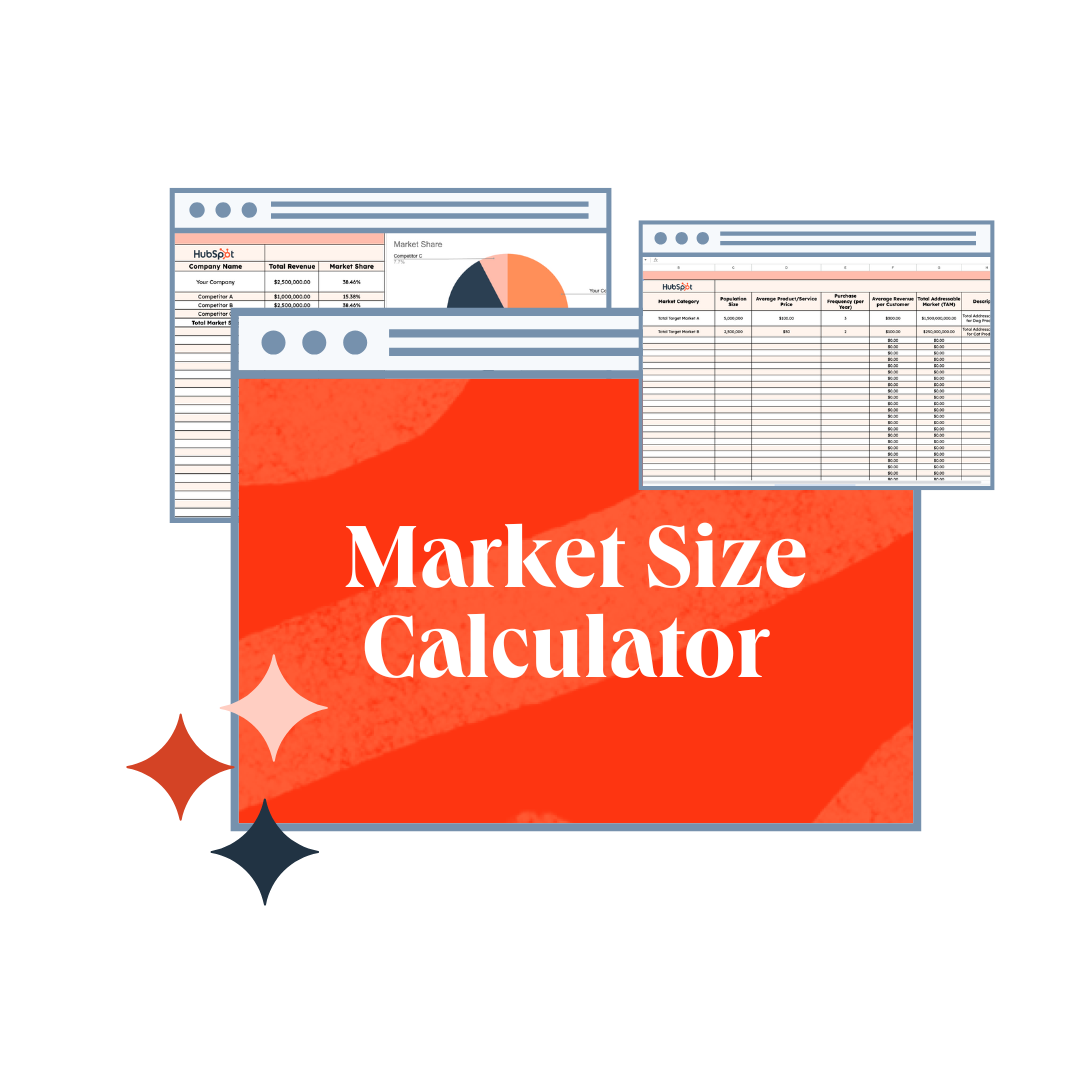
Free Market Size Calculator
Five calculators to help you quickly and easily calculate your market size
- Total Addressable Market (TAM)
- Serviceable Addressable Market (SAM)
- Market Size & Share
- Market Penetration Rate
Download Free
All fields are required.
Form not available
You're all set!
Click this link to access this resource at any time.
Table of Contents
- TAM SAM SOM
- TAM vs SAM vs SOM: Definitions
- Why TAM SAM SOM Matters
- How to Calculate TAM, SAM, and SOM
- How to Use a TAM, SAM, and SOM for Your Business
- Common TAM, SAM, SOM Mistakes to Avoid
- Right Size Your Market Opportunities with TAM, SAM, and SOM
TAM SAM SOM
TAM, SAM, and SOM are acronyms for three metrics to describe the market your organization operates in — Total Addressable Market, Serviceable Addressable Market, and Serviceable Obtainable Market.
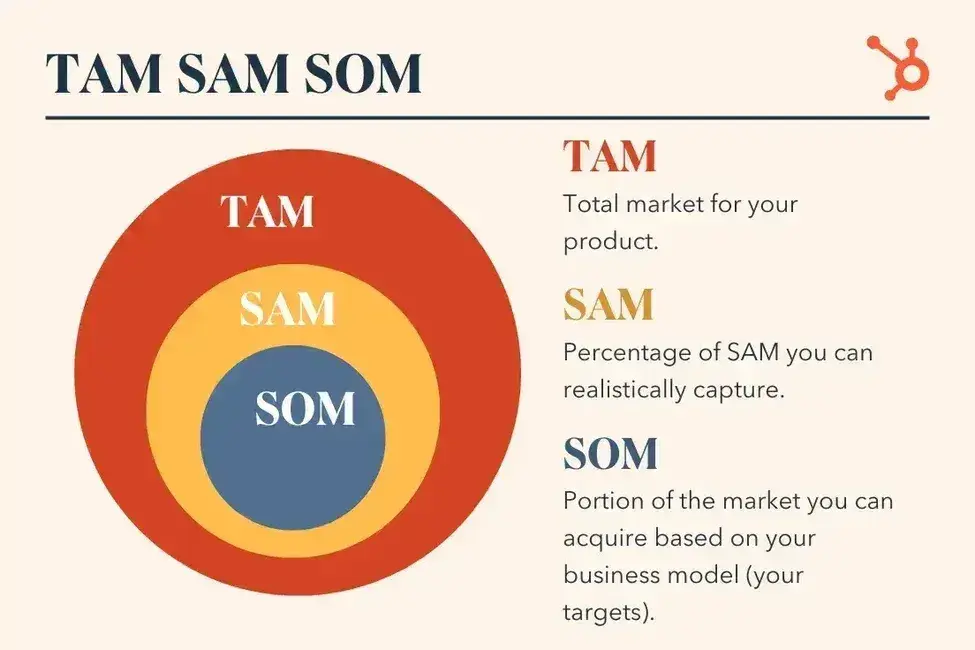
These metrics are key components of a business plan, particularly as you craft your marketing and sales strategy, set realistic revenue goals, and choose to enter the markets that are worth your time and resources.
Before I break down how to use these in your business, let’s get clear on what TAM, SAM, and SOM are and how they relate to one another.
TAM vs SAM vs SOM: Definitions
If you’re new to TAM SAM SOM, it’s easy to feel like you took a wrong turn somewhere and landed in alphabet soup.
But TAM, SAM, and SOM are simply overlapping metrics that make it easier to fine-tune your business plan, identify achievable goals, and understand the potential revenue and operational impacts of certain business decisions.
So, let’s break them down.
TAM (Total Addressable Market)
TAM Definition: The maximum potential demand of a specific market.
I know it can seem like finding this information can feel like a big task, so I’ll show you how to calculate TAM below.
In the meantime, to simplify further, the total addressable market (TAM) refers to the total market size — specifically, the demand for a product or service. It’s the maximum amount of revenue a business can generate by selling its product or service to a specific audience.
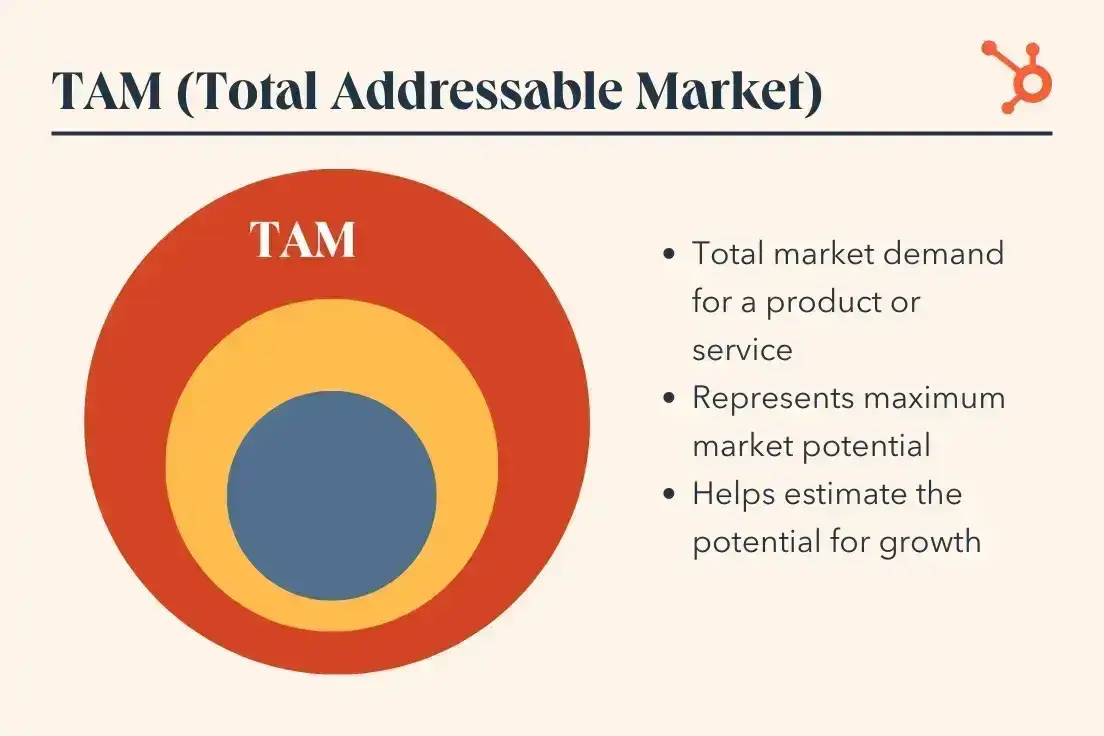
Total addressable market is most useful for businesses to objectively estimate a specific market’s potential for growth. This data also helps companies figure out product-market fit.
SAM (Serviceable Addressable Market)
SAM Definition: The size of the TAM you can reasonably target as you build your audience.
Every business model has its limitations. This can include a specialization or geographic boundaries, among other variables. Whatever yours may be, they will make it tough to service your total addressable market. That’s where SAM comes in.
SAM is a segment of TAM you can use to identify the addressable potential of a market segment, or the amount you can realistically market or sell to, making it easier to estimate revenue and audience targets.
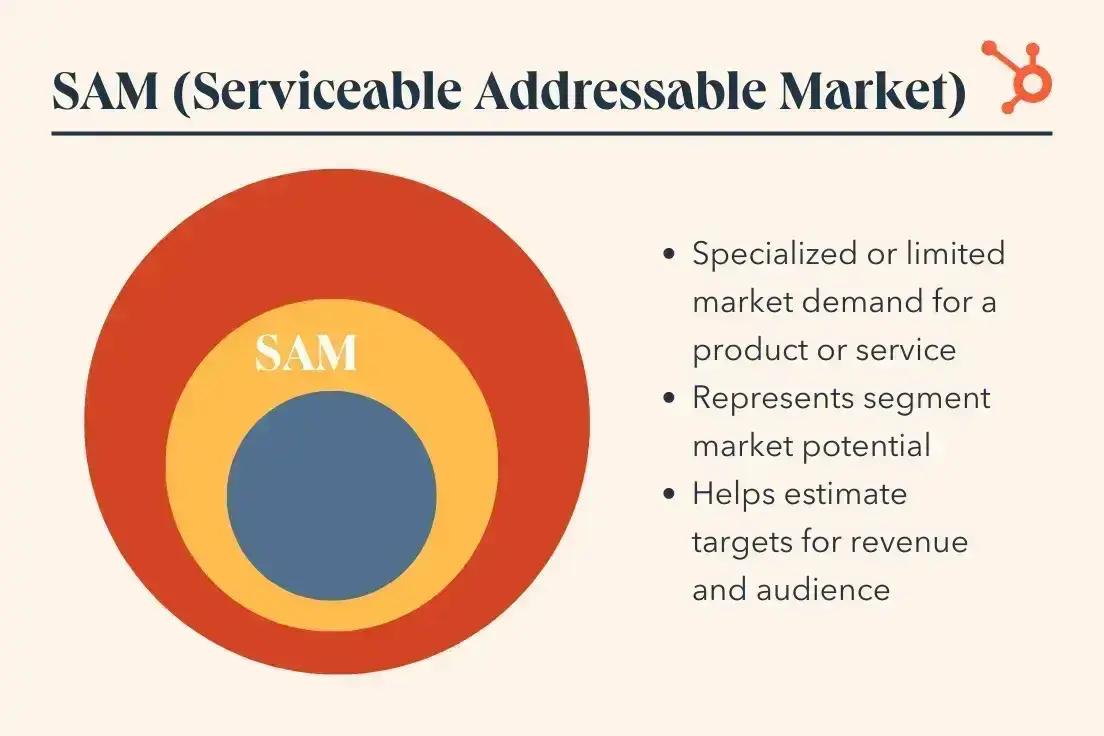
Serviceable addressable market is most useful for businesses to objectively estimate the part of the market they can acquire to figure out their targets.
SOM (Serviceable Obtainable Market)
SOM Definition: The size of the SAM you can potentially convert.
Unless you're a monopoly, you most likely can’t capture 100% of your serviceable addressable market. Even if you only have one competitor, it would still be extremely difficult to get an entire market to buy only your product or service.
That’s why it’s crucial to measure your serviceable obtainable market (SOM) to estimate how many customers could realistically benefit from buying your product or service.
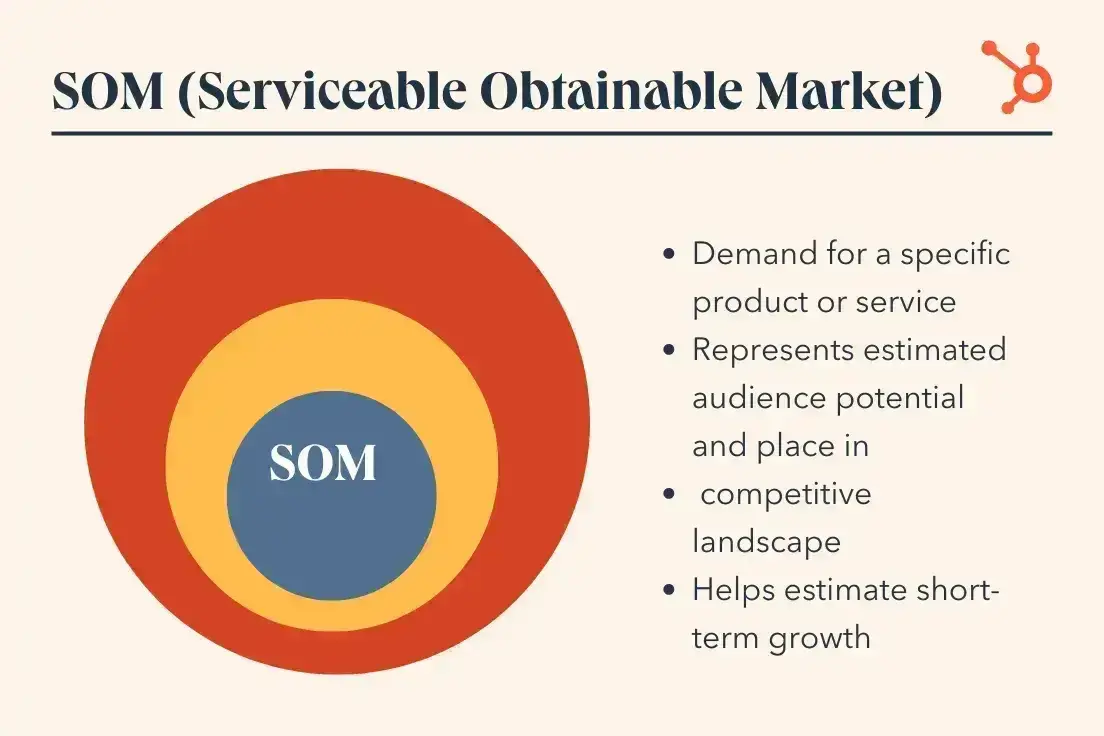
Serviceable obtainable market is most useful for businesses to determine short-term growth targets. It can also help with competitive awareness and strategizing.
Why TAM SAM SOM Matters
TAM, SAM, and SOM are essential to business strategy and growth planning. This is because these metrics show how much opportunity a particular market holds at every stage of business growth.
TAM SAM SOM is also useful because it’s a simple and succinct way to present the value of an idea. This data gives teams an idea of the target audience and income opportunities for a market or niche.
These metrics can also help businesses share key insights with investors if they are seeking funding. The process makes it easier to .
For example, say you don't have a clear picture of the right segment for your SAM. This could make your serviceable addressable market too big, which can then impact your SOM.
“In my experience, these tools are extremely informative when determining how to niche. Take the time, and understand the opportunity or lack thereof with your new target,” says of .
Highby says as her team niches further in their business, they use numbers from market research reports from firms like Gartner, Forrester, etc., as well as government and trade associations to calculate TAM, SAM, and SOM. They can then “find out which niche is the most viable,” says Highby.
Free Market Size Calculator
Five calculators to help you quickly and easily calculate your market size
- Total Addressable Market (TAM)
- Serviceable Addressable Market (SAM)
- Market Size & Share
- Market Penetration Rate
Download Free
All fields are required.
Form not available
You're all set!
Click this link to access this resource at any time.
How to Calculate TAM, SAM, and SOM
Now that you know what each of these acronyms is and what they’re used for, let’s get into the nitty-gritty of how to calculate TAM, SOM, and SAM.
There are two primary approaches to calculating these values: top-down and bottom-up. Each has distinct advantages and use cases.
Top-down Approach
The top-down method starts with broad market data and narrows down based on your limitations, product, etc. You begin with total industry size from research reports (like Gartner or IBISWorld), then apply percentage-based assumptions to estimate your addressable market segments.
- Pros: Quick to execute, useful for early-stage planning, provides big-picture context
- Cons: Relies heavily on assumptions, can be less precise, may overlook market nuances
- Best for: Initial business planning, investor pitches requiring market size context, and industries with robust published research
Bottom-Up Approach
The bottom-up method builds your market estimate from actual data points like customer counts, pricing, sales metrics, and conversion rates. You start with what you can directly observe or measure, then scale up based on concrete evidence.
- Pros: More accurate and defensible, grounded in real data and market intelligence, reveals operational insights
- Cons: Time-intensive, requires substantial customer data, harder for early-stage companies
- Best for: Detailed financial modeling, operational planning, businesses with existing customer data, securing growth-stage funding
Which Should You Use?
Most businesses can benefit from using both approaches. That said, I’d recommend starting with top-down analysis to understand the broader market opportunity, then validate and refine with bottom-up calculations based on your actual business metrics.
When the two methods produce similar results, you can have greater confidence in your market estimates. When they diverge significantly, it signals areas requiring deeper investigation.
For the calculations presented here, we’ll use a bottom-up approach.
Total Addressable Market (TAM) Calculation
TAM is useful for:
- Starting a new business.
- Launching a new product, service, or product category.
- Reviewing market strategies.
- Revising or revisiting your business plan.
- Identifying opportunities to increase market share.
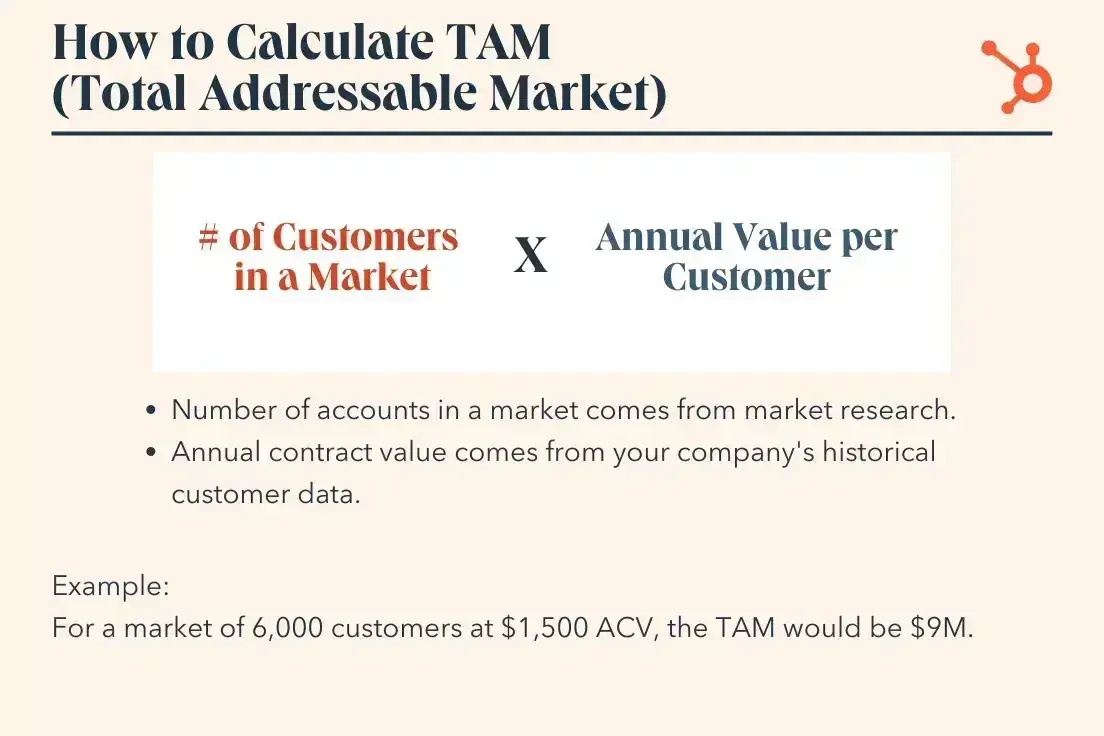
TAM = Total Customers in Market * Average Revenue/customer
The best way to calculate the total addressable market is by running a bottom-up analysis of an industry, as it’s grounded in observable, verifiable data rather than broad assumptions.
Given this number's impact on funding decisions and even product strategy, it’s better to be as accurate as possible to minimize your chance of overselling or underperforming. Better to exceed expectations rather than fall dramatically short.
Follow these steps:
- Count the total number of customers in a market.
- Identify the average annual revenue of each customer in this market.
- Multiply the two numbers.
Let’s look at an example.
Example TAM Calculation
Let‘s say you’re launching a luxury women's apparel brand targeting affluent American women.
Step 1: Count the total number of customers in your market
According to , there are approximately 54.5 million U.S. households with an income of $100,000 or above (the demographic typically targeted by high-end fashion brands). that women accounted for 51.1% of luxury apparel spending in 2026.
54.5 million households × 0.5165 = 27.79 million potential customers
Step 2: Identify the average annual revenue per customer
Industry analysis suggests that affluent women typically spend 3-5x times , putting their annual luxury spending at approximately $2,000-$3,000.
Using a conservative mid-range estimate, that makes the AVC: $2,500
Step 3: Multiply the two numbers
27.79 million customers × $2,500 per customer = $69.47 billion TAM
This means the total addressable market for high-end women's apparel targeting affluent U.S. consumers is approximately $69.47 billion annually.
And our estimate is not far off. According to , the luxury spending market in the United States is expected to exceed $144 billion in 2026. If the same percentage of women accounts for this spending in 2026, the market would reach about $73.44 billion.
Pro tip: If you want to make your life easier when calculating TAM, . It completely demystified the concept for me and helped me understand not just tam, but also the ACV itself.
Serviceable Addressable Market (SAM) Calculation
After we have our TAM, we niche down further to find our SAM.
SAM is useful for:
- Planning new marketing strategies and sales tactics.
- Doing market research and competitive analysis.
- Determining product viability.
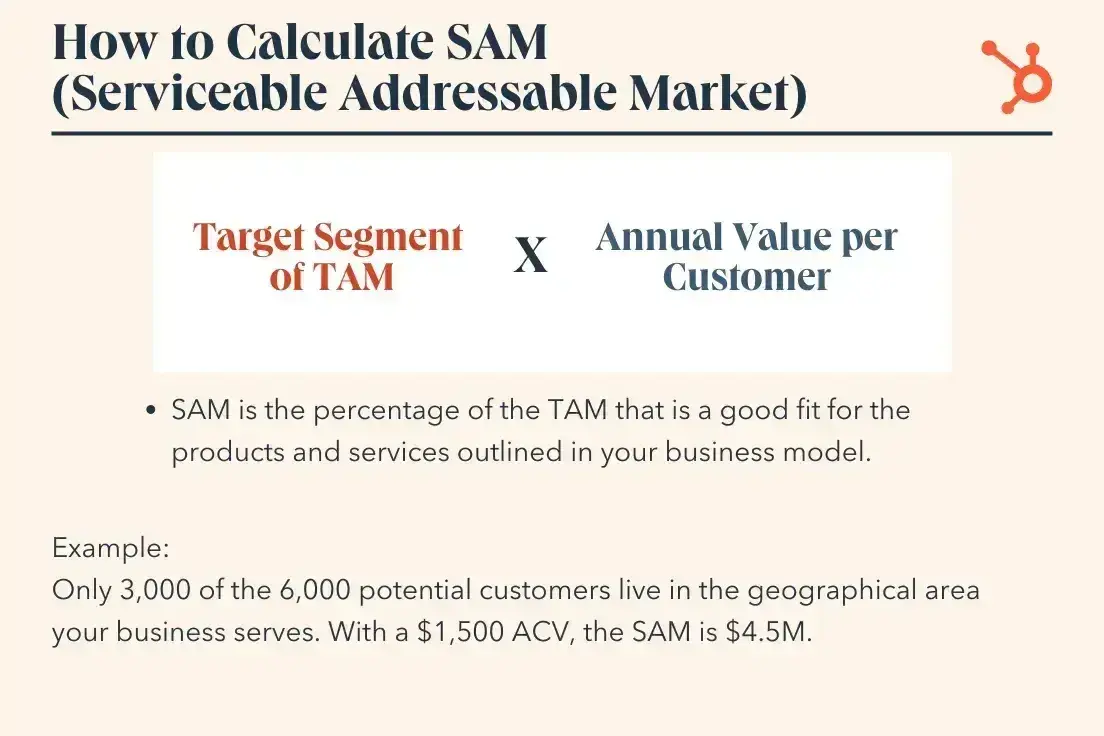
To calculate your serviceable addressable market:
- Count up all the potential customers that would be a good fit for your business.
- Find the average annual revenue of these types of customers in your market.
- Multiply the two numbers.
Example SAM Calculation
Step 1: Count up all the potential customers that would be a good fit for your business.
To continue using our sample luxury women’s apparel brand, say we were looking at women ages 25-65. Using data from the latest census, there are 20 million women in that range.
Step 2: Find the average annual revenue of these types of customers in your market.
Let’s say that each year, those 20 million women spend $2,500 on average every year on apparel.
Step 3: Multiply the two numbers.
That brings our SAM calculation to:
20 million x $2,500 = $50 billion SAM
Serviceable Obtainable Market (SOM) Calculation
Last but not least, we calculate our SOM. SOM is useful for:
- Budgeting for operations and marketing.
- Creating achievable, reasonable growth plans.
- Developing marketing and sales strategies.
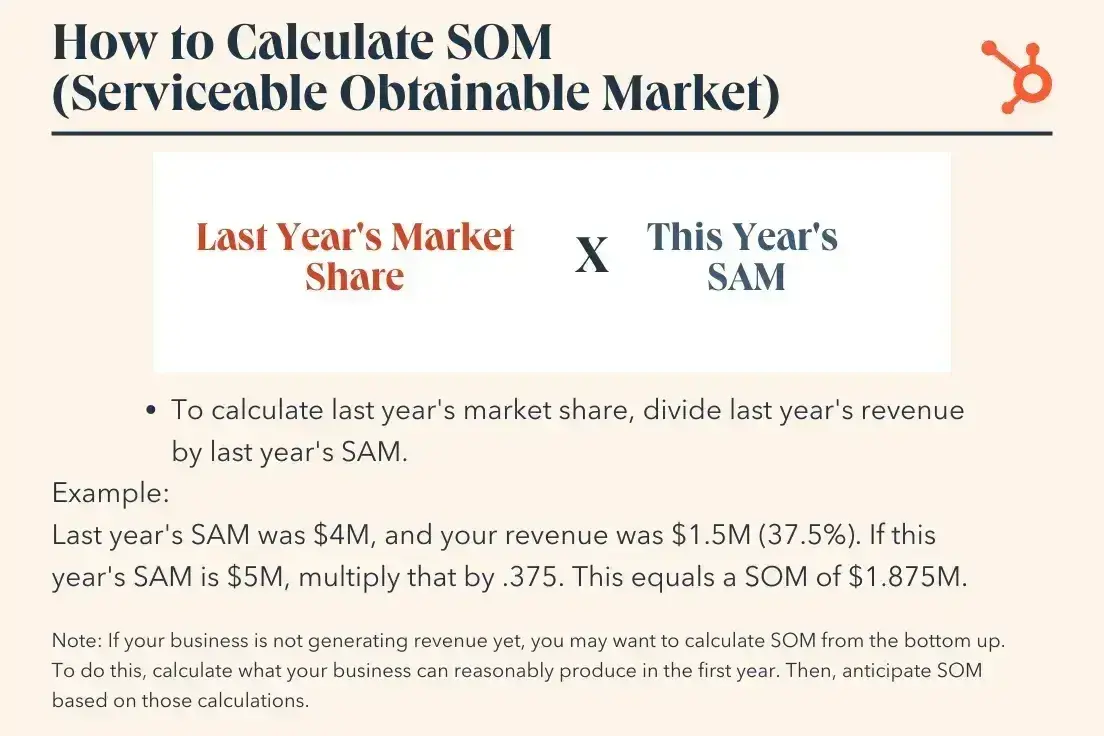
To calculate your serviceable obtainable market, you follow these steps:
- Divide your revenue from last year by your industry’s serviceable addressable market from last year. This percentage is your market share from last year.
- Multiply your market share from last year by your industry’s serviceable addressable market from this year to find your new SOM.
Example SOM Calculation
Now, here, we have to get more hypothetical, especially if you’re a new business. Because the TAM and SAM speak to total markets available, and SOM speaks to more realistic market share, we may have to make up some numbers.
Our luxury women’s apparel brand has a higher price per item, but most customers are likely to buy fewer pieces, and we’re likely to have fewer customers than, say, Walmart.
For the sake of round numbers, let’s say:
- We had $500 million in revenue for last year, 2025.
- The SAM for 2025 was 40 billion.
- Our SAM in 2026 is $50 billion.
Note: If you’re an existing business using HubSpot, Assistant can help you draw actual market and sales insights from and .
Step 1:
$500 million / $40 billion 2025 SAM = 0.0125 market share
Step 2:
0.0125% x $50 billion 2026 SAM = $625 million
That means, based on these fictional revenue numbers that show increasing demand, my fictional apparel company can reasonably expect growth over last year. And if that’s accurate, it has significant repercussions for budgeting, operations, and production.
However, if something drastic happens in the big picture that reduces spending in 2026 when it increased it in 2025, there’s a good chance these numbers are not realistic, so it’s important to go back to the numbers to make sure we’re factoring in things accurately.
Free Market Size Calculator
Five calculators to help you quickly and easily calculate your market size
- Total Addressable Market (TAM)
- Serviceable Addressable Market (SAM)
- Market Size & Share
- Market Penetration Rate
Download Free
All fields are required.
Form not available
You're all set!
Click this link to access this resource at any time.
How to Use a TAM, SAM, and SOM for Your Business
This all sounds valuable, right? But it can be tough to understand how to actually use the TAM SAM SOM calculations and data for your business. So, here are some key use cases.
Define your market.
Before you can do a TAM SAM SOM, you need to figure out what your market is, and what you’re marketing — a service, a specific product, or even a category of products.
To find this, get as clear and specific as you can about your audience, factoring in aspects like:
- Geographic location(s).
- Gender.
- Age.
- Characteristics.
- Problem your offer solves.
Use a TAM calculation to find the total market size.
Now, it’s market research time. Dig in to find out how many potential customers are out there and the potential revenue value if everyone in that market purchases.
For example, if I’m looking at women ages 25-65, as I mentioned above, I’d want to know how many women fit that definition. Then, I’d calculate the potential revenue if all those millions of women bought your product using our TAM calculation.
Use a SAM calculation to find the size of your potential market.
As in the example above, let’s say I work for a high-end women’s professional clothing retailer targeting the U.S. market. In this step, I use our SAM calculation to determine how many women fit the age range of 25 to 65 in the U.S. and then calculate the potential revenue.
Use a SOM calculation to find your potential market share.
People living paycheck to paycheck are less likely to shop my brand, so they are less likely to be my target market.
Since my SOM calculation estimates the portion of the SAM I can realistically market to, I might find it by refining my market segmentation by income and/or employment. I can then refine it further by identifying the portion of that market I’m likely to capture, given the competitive landscape.
Identify opportunities and challenges.
Now that you have the calculation, it’s time to dig into the data and strategize. I’ll start by asking questions like:
- What is the market doing now?
- What do your competitors do well? Poorly?
- Any gaps in the market?
- Are there any segments of the market that aren’t being served?
Then, when I have answers, I can think about strategies to stand out from the competition and lean into my strengths to reach my market.
Common TAM, SAM, SOM Mistakes to Avoid
Even experienced founders make critical errors when calculating market sizes. Here are the most common pitfalls and how to sidestep them:
1. Confusing TAM with Your Revenue Potential
TAM represents the entire market opportunity, not what your company can realistically capture. Treating TAM as your achievable revenue leads to wildly unrealistic projections and erodes investor confidence.
How to avoid it:
- Always present all three metrics together (TAM, SAM, SOM)
- Make clear distinctions: “The TAM is $X billion, but our realistic 5-year target based on our distribution capacity is our SOM of $Y million.”
- Use SOM for financial projections, not TAM
2. Using Top-Down Analysis Without Bottom-Up Validation
Saying “we'll capture 1% of a $10 billion market” sounds great, but it’s meaningless without proving you can actually acquire and serve those customers. This raises red flags about your understanding of customer acquisition and even how serious and realistic you are about your business idea.
How to avoid it:
- Start with bottom-up calculations based on real customer data, pricing, and known unit economics
- Use top-down analysis only as a sanity check or for initial market context
- If the two approaches yield vastly different numbers, investigate why before presenting either one
3. Ignoring Market Constraints and Barriers to Entry
According to , 42% of startups fail because there is no market need for their product. Calculating TAM based purely on demographics or spending data while ignoring practical constraints like regulatory barriers, competitor dominance, and customer acquisition realities often leads to building products nobody wants. Not to mention a lot of lost money and broken dreams.
How to avoid it:
- Factor in addressable barriers: licensing requirements, certification needs, geographic limitations, language barriers, startup overhead.
- Account for entrenched competition. For example, if three major players control 80% of the market share, acknowledge this in your SAM and SOM.
- Consider customer-acquisition realities: How long is a typical sales cycle? What's the realistic conversion rate?
4. Using Outdated Data or Mixing Timeframes
Markets shift rapidly. Using old data or combining figures from different years creates inaccurate projections that can lead to poor strategic decisions and misallocated resources.
How to avoid it:
- Only use data from the last two years. Anything older does not reflect the current market. Cite publication dates for all sources.
- Ensure all calculations use consistent geographic boundaries and timeframes.
- When recent data isn't available, explicitly state your assumptions and adjustments for market growth.
- Review and update your TAM analysis regularly, at least annually or when major market changes occur.
I know finding accurate or current data is difficult. (It was even for the TAM SAM SOM examples I shared). But doing this research upfront or disclosing any assumptions will save you a lot of headaches down the road.
Right Size Your Market Opportunities with TAM, SAM, and SOM
When I started my marketing, TAM, SAM, and SOM felt like abbreviation-heavy jargon. It was easier to just nod along and let the numbers go in one ear and out the other.
However, today, I know these numbers matter. I even run the calculations myself!
As you get started, keep in mind that these figures will largely be estimates to inform your strategy. The more market research you do and the more historical data you build up, the more precise your planning will be.
Don't just figure out the opportunities in your market. Use your research to decide who you want to target and how you plan to engage them with your products. Then, use these templates to make your plans clear.
Free Market Size Calculator
Five calculators to help you quickly and easily calculate your market size
- Total Addressable Market (TAM)
- Serviceable Addressable Market (SAM)
- Market Size & Share
- Market Penetration Rate
Download Free
All fields are required.
Form not available
You're all set!
Click this link to access this resource at any time.
Conducting Market Research
![How to do market research and better understand your target customers [+ AI prompts & template]](https://53.fs1.hubspotusercontent-na1.net/hubfs/53/Operation-everest-market-research-1-20250916-346125.webp)
![9 Best 糖心Vlog Research Methods to Know Your Buyer Better [+ Examples]](https://53.fs1.hubspotusercontent-na1.net/hubfs/53/market%20research%20methods%20feat.png)
![SWOT Analysis: How To Do One [With Template & Examples]](https://53.fs1.hubspotusercontent-na1.net/hubfs/53/marketingplan_20.webp)


.jpg)