.png?width=112&height=112&name=Sales%20Conversion%20and%20Close%20Rate%20Calculator%2001-300%20(1).png)
Regression analysis entails determining the relationship between two variables. It’s like playing detective, but instead of solving mysteries, we solve puzzles about data.
Regression forecasting uses statistical analysis to predict future business outcomes — like sales or revenue — based on historical data. It helps marketing and sales leaders make data-driven decisions, set accurate quotas, and plan resources with confidence. To perform regression forecasting, start by collecting the data, choosing the right regression type (like linear or time series), building and testing the model, and validating its accuracy. Tools like HubSpot's can automate much of this process, making advanced forecasting accessible to any team.
If the idea of using regression analysis seems daunting, fear not. This piece offers an easy-to-understand breakdown of how to use regression analysis, when to use it, and how it works in sales. Plus, it provides an easy-to-follow example using Google Sheets.
Table of Contents
- What is regression forecasting for sales?
- Regression Analysis Examples
- Ex-ante vs Ex-post Sales Forecasting
- What is regression analysis used for?
- What is regression analysis in sales?
- How to Use Regression Analysis to Forecast Sales
- Why use regression analysis?
- Sales Regression Forecasting Tools: From Spreadsheets to AI
- Frequently Asked Questions About Regression Forecasting
What is regression forecasting for sales?
Regression forecasting predicts future business outcomes using historical data. It’s a statistical method that speculates future sales by analyzing relationships between variables. Think of it as connecting the dots between what drives sales (like marketing spend or seasonality) and actual results — then using those patterns to see what’s coming next.
For sales teams, regression analysis transforms historical data into actionable predictions. Instead of guessing next quarter’s numbers, this analysis uses mathematical relationships to forecast with confidence.
There are multiple types of regression analysis. Here are some short definitions:
1. Linear Regression
Linear regression forecasting is the most basic and common type of regression analysis that uses the following equation: Y = bX + a. On a graph, linear regressions look like what you’re probably already imagining.
Let’s say a business owner is trying to determine the correlation between heat and ice cream consumption. On one side, there’s temperature (how hot it is), and on the other, the number of ice cream cones sold.

Linear regression is like drawing a straight line through the points on this graph. This line helps to predict how many ice cream cones one might sell at a certain temperature.
Best for: Forecasting when the relationship between variables is simple, proportional, and approximately straight-line; situations where one main factor drives the outcome; or creating easy-to-explain, quick baseline forecasts.
2. Nonlinear Regression
Nonlinear regression is a statistical method used to model relationships where the effect of one or more independent variables on a dependent variable does not follow a straight line. It captures complex patterns such as curves, saturation points, or diminishing returns that linear models cannot represent.
Sometimes, two variables don’t follow a straight-line relationship.

As the temperature increases, people buy more ice cream. But maybe, when it gets really hot, people start to slow down and buy less ice cream. Nonlinear regression is like drawing a curved line through the points. This helps to account for more complex relationships.
Best for: Forecasting when relationships curve, level off, peak, or decline; modeling real-world saturation, diminishing returns, or thresholds; and situations where linear models clearly underperform.
3. Multiple Linear Regression
Multiple linear (multilinear) regression is a statistical technique used to predict one dependent variable using two or more independent variables that have a linear relationship with the outcome. It helps quantify the individual impact of each predictor while holding the others constant.
What if the number of ice cream cones sold also depends on other variables, like the day of the week or whether there’s a nearby festival?
Multiple linear regression lets businesses consider several factors at once. It’s like drawing a line in a 3D space or even higher dimensions.
Best for: Forecasting a single outcome influenced by several factors, understanding the relative impact of multiple variables, and business decisions where many inputs interact with one main result.
4. Multivariate Regression
Multivariate regression analysis is a statistical method used to model and predict multiple related dependent variables simultaneously based on one or more independent variables. It helps capture how shared inputs influence different outcomes and how those outcomes are related to each other.
How about looking at more than one outcome at the same time, rather than predicting just a single result?
For instance, instead of only forecasting the number of ice cream cones sold, a shop owner may want to predict both ice cream sales and cold drink sales simultaneously. These outcomes are related and may be influenced by the same factors — such as temperature, day of the week, and whether a local festival is taking place.
In this case, temperature might increase both ice cream and cold drink sales, while weekends or festivals could boost ice cream sales more strongly than drinks. Multivariate regression models these relationships together, capturing how the same inputs affect multiple dependent variables at once.
Best for: Forecasting multiple related outcomes simultaneously, capturing how the same inputs affect different results in different ways, and situations where dependent variables are correlated with each other.
.png)
Free Sales Metrics Calculator
A free, interactive template to calculate your sales KPIs.
- Average Deal Size
- Customer Acquisition Cost (CAC)
- Customer Lifetime Value (CLV)
- And more!
Download Free
All fields are required.
Form not available
You're all set!
Click this link to access this resource at any time.
Regression Analysis Examples
Now that the basics of the different types of regression analyses and how they work have been covered, here are some real-world ways to use them.
1. To evaluate the effectiveness of a marketing campaign.
Imagine a marketer just joined a marketing team at a B2C company and needs to assess the efficacy of different channels (i.e., TV, online, social media) on sales.
To help them figure this out, the marketer would complete a multiple linear regression — using sales data and marketing spend for each channel — to analyze the impact of each marketing channel on sales.
In this example, here’s what the regression analysis equation would consist of:
- Sales is the dependent variable to predict.
- a is the intercept, representing the baseline sales level when all marketing spends are zero.
- b (which would be multiple coefficients — b1, b2, and b3 — here) represents the impact of each marketing channel on sales.
2. To assess risk in lending.
Let’s say a loan officer wants to know how much interest to charge on customer loans. Charging too much could drive customers away, while charging too little could reduce the bank’s profit.
To solve this, the loan officer would run a linear regression analysis on past loan data. The officer will consider factors such as a customer’s credit score, income history, and loan amount. The analysis would then show how each variable relates to the likelihood of a customer defaulting on the loan.
After gathering this information, the linear regression analysis would predict the risk of repayment failure for new loan applicants, helping the officer set interest rates fair to both the bank and the customer.
In this example, here’s what the regression analysis equation would consist of:
- Repayment probability is the dependent variable the officer would want to predict.
- a is the intercept, representing the baseline default probability when all other factors are zero.
- b (which would be multiple coefficients — b1, b2, b3 — here) represents the impact of each factor on the repayment probability.
3. To determine a pricing strategy.
Consider a scenario where a team at a tech company is preparing to launch a new product. The leadership team wants to determine an optimal pricing strategy before rolling it out to customers.
To evaluate how price might affect demand, the data team could use a nonlinear regression analysis to model the relationship between pricing and expected sales performance. Market research data, competitor pricing, and historical sales from similar products would serve as inputs to help identify a price point that maximizes revenue.
In this example, here’s what the regression analysis equation would consist of:
- Demand is the dependent variable to predict.
- a is the intercept, representing baseline demand when the price is zero.
- b (which would be multiple coefficients — b1, b2 — here) represents the nonlinear relationship between price and demand.
Now, it’s understandable if these types of explanations don’t paint the prettiest picture. In reality, regression analyses aren’t the most colorful, especially if you don’t already have a grasp of the full regression analysis process.
However, tools like 贬耻产厂辫辞迟’蝉 software make regression analysis straightforward and helpful.
Ex-ante vs. Ex-post Sales Forecasting
Ex-ante sales forecasting is done before outcomes occur. It is used to predict future sales based on assumptions, historical trends forecasts, market conditions, and planned actions. For example, a sales team may forecast next quarter’s revenue before launching a new pricing strategy or hiring additional sales reps. This lets ex-ante forecasts guide budgeting, capacity planning, and target setting. That said, the accuracy of ex-ante forecasts depends on the quality of assumptions and available data.
Ex-post sales forecasting occurs after results are known. It compares predicted sales (the ex-ante forecast) against actual performance to evaluate forecast accuracy and identify gaps. For instance, after a campaign ends, sales leaders may assess whether projected pipeline conversions matched reality. Ex-post analysis is typically more accurate because it relies on realized data.
In sales planning, ex-ante forecasting supports decision-making, while ex-post forecasting improves future forecasts by refining forecasting models, assumptions, and sales processes.
What is regression analysis used for?
Regression analysis is typically applied when predicting future trends or outcomes; it’s also used in more conventional situations.
Sports coaches use it to analyze player performance and make strategic decisions during games. Economists use it to predict changes in interest rates. Overall, it’s a pretty helpful tool for making informed decisions based on data.
But since regression analysis is most commonly used by sales folks, the focus here will be on what regression analysis looks like when used for sales forecasting.
What is regression analysis in sales?
In simple terms, sales regression analysis is used to understand how certain factors in sales processes affect sales performance and predict how sales would change over time if a business continued the same strategy or pivoted to different methods.
Now, independent and dependent variables are still at play here, but the dependent variable is always the same: sales performance. Whether it’s total revenue or number of deals closed, the dependent variable will always be sales performance. The independent variable is the factor the sales leader is controlling to observe how it affects sales performance, like the number of salespeople the business has or how much money is spent on advertising.
Sales regression forecasting results help businesses understand how their sales teams are or are not succeeding and what the future could look like based on past sales performance. The results can also be used to predict future sales based on changes that haven’t yet been made, like if hiring more salespeople would increase business revenue.
贬耻产厂辫辞迟’蝉 allows teams to perform complete forecasts across pipelines, empowering them to make informed decisions with confidence.
How to Use Regression Analysis to Forecast Sales
Regression forecasting might sound complex, but these financial forecasts can be made with a structured approach. Here’s how.
Step 1: Define the forecasting question.
Start with a specific, measurable question. The question should identify:
- Your dependent variable (what you’re predicting): closed deals.
- Your independent variable (what influences it): number of sales calls.
- Your business goal: Optimize sales activity for maximum results.
For this example, the question is, “Will increasing sales calls from 40 to 50+ per month significantly increase closed deals?”
Step 2: Collect and prepare historical data.
To conduct this forecast, get historical data that depicts the number of sales calls made over a certain period. Mathematically, the number of sales calls is the independent variable, or X value, and the dependent variable is the number of deals closed per month, or Y value.
The data set below represents monthly sales calls and a corresponding number of deals closed over two years.
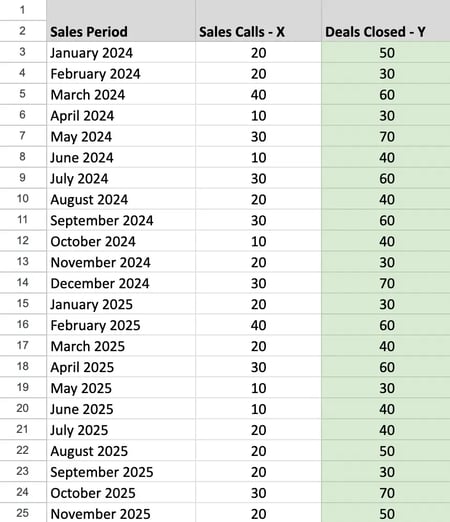
So, the overall regression equation is Y = bX + a, where:
- X is the independent variable (number of sales calls)
- Y is the dependent variable (number of deals closed)
- b is the slope of the line
- a is the point of interception, or what Y equals when X is zero
Since we’re using Google Sheets, its built-in functions will do the hard stuff for us, so we won’t need to try and calculate the values of these variables. We’ll use the historical data table and select the correct graph to represent our data.
Step 3: Choose the regression model.
Different queries may require different regression models. Since we’re examining one relationship (calls to deals), we’ll use simple linear regression with the equation Y = bX + a, where:
- Y = number of deals closed
- X = number of sales calls
- b = the slope (how much Y changes when X increases)
- a = the intercept (baseline deals with zero calls)
Step 4: Create the chart.
The first step of the process is to highlight the numbers in the X and Y columns and navigate to the toolbar, select Insert, and click Chart from the dropdown menu.

The default graph that appears isn’t what we need, so click on the Chart editor tool and select Scatter plot, as shown in the image below.

After selecting the scatter plot, click Customize, Series, then scroll down to select the Trendline box (shown below).

And after all of these customizations, the following scatter plot will result.

The Sheets tool did the math, and the line in the chart is the b variable from the regression equation, or slope, that creates the line of best fit. The blue dots are the y values, or the number of deals closed based on the number of sales calls.
Now, the scatter plot answers our original question: Will having salespeople make more sales calls and close more deals? By looking at the visual representation of the data, the answer is yes, and we know this because the line of best fit trendline is moving upwards, which indicates a positive relationship.
Even though one month can have 20 sales calls and 10 deals, and the next has 10 calls and 40 deals, the statistical analysis of the historical data in the table assumes that, on average, more sales calls mean more deals closed.
This data tells a story. It means that having salespeople make more calls per month will increase deal count. However, this scatter plot does not give the specific forecast numbers needed to understand future sales performance. So, let’s use the same example to obtain that more thorough information.
Let’s say we’re now looking to find out how to generate more quarterly revenue, which is directly related to sales activity. While assuming closing more deals means generating more revenue, we still want the data to prove that having salespeople make more calls would actually close more deals.
The built-in FORECAST.LINEAR equation in Sheets will help make this clear, based on the historical data in the first table.
Step 5: Create a new table in the same sheet, using the same columns from the original table.
Make a table like the one below within the same sheet to create a forecast breakdown. In the Sheets document, this new table uses the same columns as the first (A, B, and C) and begins in row 26.
I went with 50 because the highest number of sales calls made in any given month from the original data table is 40, and we want to know what happens to deal totals if that number actually increases. I could’ve only used 50, but I increased the number by 10 each month to get an accurate forecast that is based on statistics, not a one-off occurrence.

Step 6: Insert a FORECAST.LINEAR function into your data set.
After creating this chart, follow this path within the Insert dropdown menu in the Sheets toolbar: Insert → Function → Statistical → FORECAST.LINEAR.
This part gets a little bit technical, but it’s not as complex as it seems. The instruction menu below tells me that I’ll obtain my forecasts by filling in the relevant column numbers for the target number of sales calls.

Here is the breakdown of the elements of the FORECAST.LINEAR equation means:
- x is the value on the x-axis (in the scatter plot) that we want to forecast, which is the target call volume.
- data_y uses the first and last row number in column C in the original table, 2 and 24.
- data_x uses the first and last row number in column B in the original table, 2 and 24.
- data_y goes before data_x because the dependent variable in column C changes because of the number in column B.
This equation, as the FORECAST.LINEAR instructions tell us, will calculate the expected y value (number of deals closed) for a specific x value based on a linear regression of the original data set.
But, there are two ways to fill out this equation. The first option, shown below, is to manually input the x value for the number of target calls and repeat for each row:
=FORECAST.LINEAR(50, C2:C24, B2:B24)
The second option is to use the corresponding cell number for the first x value and drag the equation down to each subsequent cell. This is what the equation would look like if I used the cell number for 50 in the second data table:
=FORECAST.LINEAR(B27, C2:C24, B2:B24)
To reiterate, I used the number 50 because I want to be sure that making more sales calls results in more closed deals and more revenue, not just a random occurrence. This is what the number of deals closed would be, not rounded up to exact decimal points.
Why use regression analysis?
Overall, the results of the above linear regression analysis and expected forecast say that the number of sales calls is directly related to the number of deals closed per month.
This is the beauty of completing regression analyses. Because the sales manager was able to make solid predictions based on pre-existing data, they can now confidently ask their sales team to make 10 more calls per month than the previous month, knowing the number of deals closed will increase and, ultimately, help the business to generate more revenue.
While Google Sheets helped with the math without any further calculations, other tools are available to streamline and simplify this process. Learn about a few of them in the following section.
Sales Regression Forecasting Tools: From Spreadsheets to AI
Choosing the right regression forecasting tool depends on a team’s technical skills, data volume, and integration needs. While Google Sheets works great for basic linear regression, growing teams need more sophisticated options. Here are tools that can help.
1.

贬耻产厂辫辞迟’蝉 Forecasting Software automates regression analysis and forecasting for business teams.
贬耻产厂辫辞迟’蝉 Forecasting Software uses a variety of data points — including past sales data, pipeline deals, and sales activities — to create accurate forecasts. Plus, with features like deal probability tracking, customizable forecasting models, and real-time reporting, it empowers sales pros to make well-informed decisions and optimize their sales strategies.
These projections can help sales leaders come up with further questions to analyze in their regression analysis to understand what is (or isn’t) going wrong.
Plus, 贬耻产厂辫辞迟’蝉 uses artificial intelligence to highlight high-value opportunities and recommend the next best actions for sales reps based on real-time buying signals, helping teams prioritize where to focus their efforts. By centralizing CRM data and AI-generated suggestions in one place, it enables sales teams to work smarter, close deals faster, and spend more time on revenue-driving activities.

What I like: When I tell you that 贬耻产厂辫辞迟’蝉 Sales Forecasting tool is extremely customizable, I’m not kidding. You can separate data and pipelines based on quarterly results, monthly results, or even teams. If you’re anything like me, having as much control over what I’m seeing and how I’m seeing it is a huge plus, especially for sales pros working collaboratively.
2.

InsightSquared is a revenue forecast intelligence platform that uses AI to make accurate predictions.
While it can’t run a regression analysis, it can give sales reps the data they need to conduct the regression on their own. Specifically, it provides data breakdowns of the teams, representatives, and sales activities that are driving the best results. Reps can use this insight to come up with further questions to ask in their regression analysis to better understand performance.
What I like: InsightSquared allows its users to track every moment of sales activities. From the initial prospecting stage to securing an actual lead, you’re not only able to see how your sales are maturing but where exactly they’re doing so (which is super important for gathering accurate sales forecasting info).
3.

Since sorting through data is essential for beginning an analysis, MethodData is a valuable tool. The service can create custom sales reports based on the variables sales pros need for their specific regression, and the automated processes save time. Instead of digging through data and cleaning it up enough to be usable, it happens automatically once a user creates their custom reports.
What I like: As I briefly mentioned above, MethodData is able to learn about your data as you work with it, which is a timesaver. Plus, its ability to do the hard stuff (like creating custom sales reports) makes the difficult aspects of completing multiple regression analyses simple.
4. Excel Analysis ToolPak
Excel’s Analysis ToolPak is a practical and widely accessible option for running regression analysis, especially for small to mid-sized sales teams. The ToolPak includes a built-in regression function that allows businesses to model the relationship between sales outcomes (such as revenue or deal volume) and influencing variables — without needing advanced statistical software.
Once enabled in Excel, users can input historical sales data, select dependent and independent variables, and generate regression outputs including coefficients, R-squared values, and standard errors. These results can then be used to forecast future sales under different scenarios by adjusting the input variables.
What I like: Excel’s Analysis ToolPak is easy to use and requires no additional software. It is ideal for testing assumptions quickly, validating forecasts, and building simple to moderately complex regression models that directly support sales planning and performance analysis.
Frequently Asked Questions About Regression Forecasting
What is regression forecasting, and how does it work?
Regression forecasting is a statistical analysis that models the relationship between a target metric (the dependent variable) and one or more influencing factors (independent variables), such as marketing spend, number of sales calls, or number of salespeople.
A regression equation can be built from historical data (for example, Y = bX + a in a simple linear model), where we estimate the coefficients, and then use the equation to forecast future values under different scenarios for the independent variables.
For example, imagine a B2B company wants to forecast monthly sales revenue.
From historical data, the sales team finds that revenue is strongly influenced by the number of monthly sales calls. Using past records, they run a regression analysis where:
- Y (dependent variable) = monthly sales revenue
- X (independent variable) = number of sales calls
The regression produces an equation such as:
Sales revenue = $5,000 × (number of sales calls) + $20,000
This means that, on average, each additional sales call is associated with $5,000 in revenue, while $20,000 represents baseline sales that occur even with minimal activity.
If the team plans to increase calls from 30 to 40 next month, the model forecasts:
- ($5,000 × 40) + $20,000 = $220,000 in sales
Sales leaders can then test scenarios — such as hiring another salesperson or increasing call targets — and immediately see the likely revenue impact.
What are the four types of regression analysis?
The most common forms are:
- Linear regression – Linear regression forecasting is used for forecasting when the relationship between variables is linear. It models a straight-line relationship between one independent variable and the dependent variable.
- Nonlinear regression – Models curved relationships when data doesn’t follow a straight-line trend.
- Multiple linear regression – Uses multiple independent variables at the same time.
- Multivariate regression – Involves multiple dependent variables or more complex structures; in many business contexts, this is used interchangeably with “multiple regression.”
What are the 7 steps in regression analysis?
A typical workflow includes:
- Specify the regression equation. Define the dependent variable and select the independent variables.
- Collect and prepare data. Gather historical values, clean the dataset, and address outliers.
- Estimate coefficients. Use statistical tools to calculate the best-fitting coefficients.
- Interpret coefficients. Understand how each independent variable influences the dependent variable.
- Evaluate model fit. Assess performance using metrics like R-squared and statistical significance.
- Validate the model. Test predictions on data not used in model training.
- Use the model for forecasting and scenarios. Plug in different values for your drivers to generate forecasts and what-if analyses.
Can linear regression be used for forecasting?
Yes. Linear regression is widely used for forecasting, including sales forecasts. It works well when the relationship between the variables is stable and roughly linear. If the data shows non-linear behavior or is influenced by many factors, more complex regression or alternative forecasting methods may be more suitable.
What’s the difference between ex-ante and ex-post forecasting?
- Ex-ante forecasting refers to predicting future outcomes before actual results are known. It is done before the event, using only the information available at the time of prediction. The business must also forecast any predictor variables.
- Ex-post forecasting means evaluating model accuracy after actual results are available. It is done after the event, using the actual values of the predictors. It isn’t used for decision-making but is valuable for evaluating how well a model would have predicted real outcomes.
How do you validate regression forecast accuracy?
You can validate a regression forecast by:
- Using holdout or out-of-sample testing.
- Using cross-validation appropriate for time-series data.
- Calculating error metrics such as Mean Absolute Error (MAE), Root Mean Squared Error (RMSE), or Mean Absolute Percentage Error (MAPE).
- Comparing ex-post and ex-ante results to determine whether errors arise from the model or from incorrect assumptions about predictor variables.
When should you use regression forecasting instead of other methods?
Regression forecasting is most useful when businesses:
- Want to understand factors influencing an outcome, not just predict the outcome.
- Have reliable historical data for both the outcome and its drivers.
- Need to run a scenario or a what-if analysis.
- Can’t use simpler time-based methods as trends or seasonality alone can’t explain changes in the dependent variable.
Regression analysis helps with a better grasp of sales performance.
A regression analysis provides statistical insight into the factors that influence sales performance.
When businesses take the time to come up with a viable regression question that focuses on specific variables and use the right data, they’ll be able to accurately forecast expected sales performance and understand what elements of their sales strategy can remain the same, or what needs to change to meet new business goals.
贬耻产厂辫辞迟’蝉 helps teams apply regression analysis to uncover which factors truly influence sales performance, turning historical data into clear, actionable insights. By organizing the right variables in one platform, teams can build more accurate forecasts and better understand which parts of their sales strategy are driving results — and which need adjustment. This enables sales leaders to confidently predict future performance while making data-backed decisions to hit new business goals.
Editor's note: This post was originally published in December 2020 and has been updated for comprehensiveness.
Free Sales Metrics Calculator
A free, interactive template to calculate your sales KPIs.
- Average Deal Size
- Customer Acquisition Cost (CAC)
- Customer Lifetime Value (CLV)
- And more!
Download Free
All fields are required.
Form not available
You're all set!
Click this link to access this resource at any time.
Sales Forecasting
![How to choose the right forecasting technique [+ expert insight and data]](https://53.fs1.hubspotusercontent-na1.net/hubfs/53/forecasting-methods-1-20260311-1924209.webp)
-Feb-24-2025-07-49-23-4986-PM.png)


![I Took a Deep Dive Into Trend Forecasting: Here’s What I Learned [+ Expert Tips]](https://53.fs1.hubspotusercontent-na1.net/hubfs/53/trend-forecasting-1-20241114-1048511.webp)